Devtools
One of the most difficult things a developer faces when creating 3D experiences in the browser is debugging. The browser canvas is a black box, and it's hard to know what's going on inside. A developer might come to rely on a series of console.logs or third-party tools just to inspect the scene.
Don't make me get started with checking the performance of your scene. 😱

One of our goals with TresJS is to offer the best DX (Developer Experience) when dealing with 3D scenes on the browser. Thanks to the declarative nature of the ecosystem plus the variety of solutions the Vue ecosystem offers such as the Vue Devtools, Nuxt and Vite, we can offer a better tooling for devs to debug their scenes.
Introducing the Devtools
From ^3.7.0 we are introducing the TresJS Devtools, a customized inspector tab for the Official Vue Chrome Devtools that allows you to inspect your TresJS scenes and components.
Features
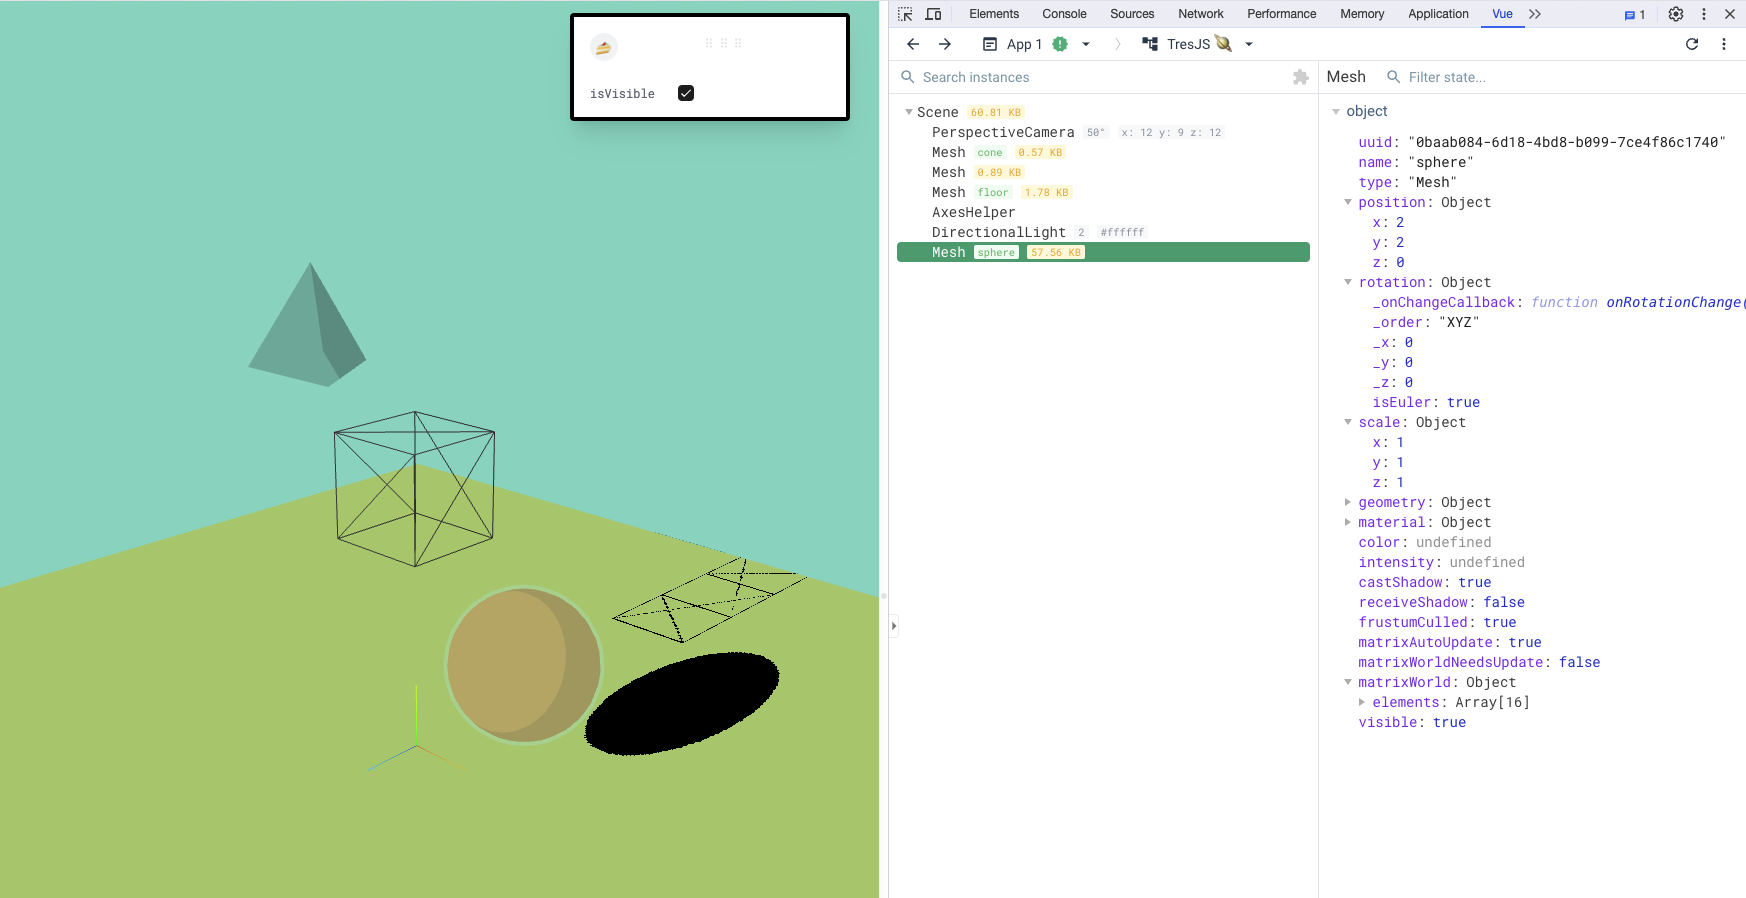
- Scene Inspector: Inspect the current scene and its components using a tree view similar to the Vue Devtools component inspector.
- Memory Allocation: See how much memory is being consumed by the components.
- Object Inspector: Inspect the properties of the selected object in the scene, including its children.
- Editable Properties: And yes, you can edit the properties of the selected object and see the changes in real-time.
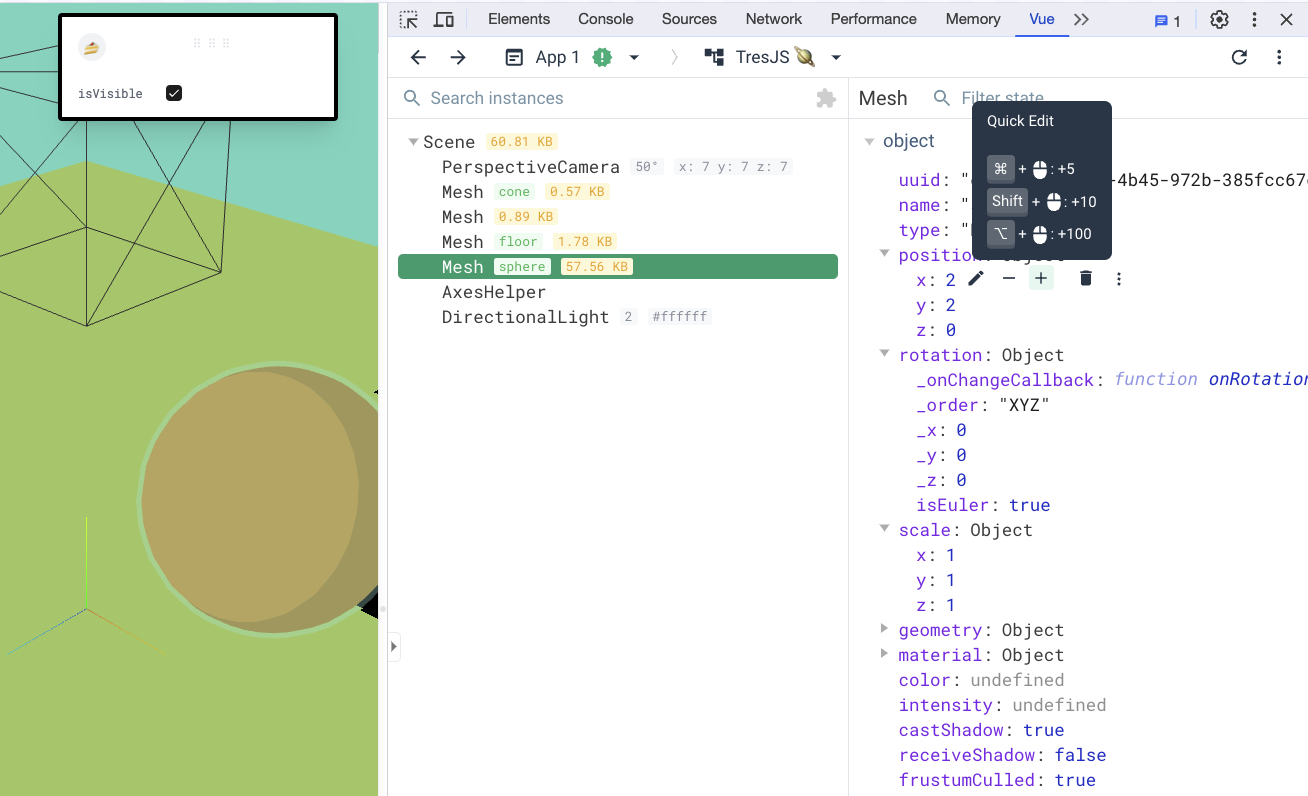
Enjoy the new Devtools and let us know what you think! 🎉
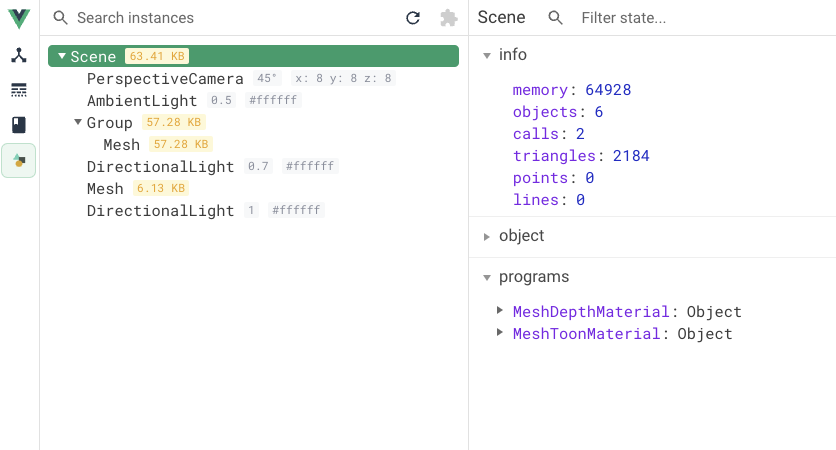
Renderer info ^4.0.0
From v4 it's possible to see the renderer information in the Devtools when inspecting the root object (Scene). This is useful to know what renderer is being used and its properties including the programs (shaders) and the capabilities of the renderer.